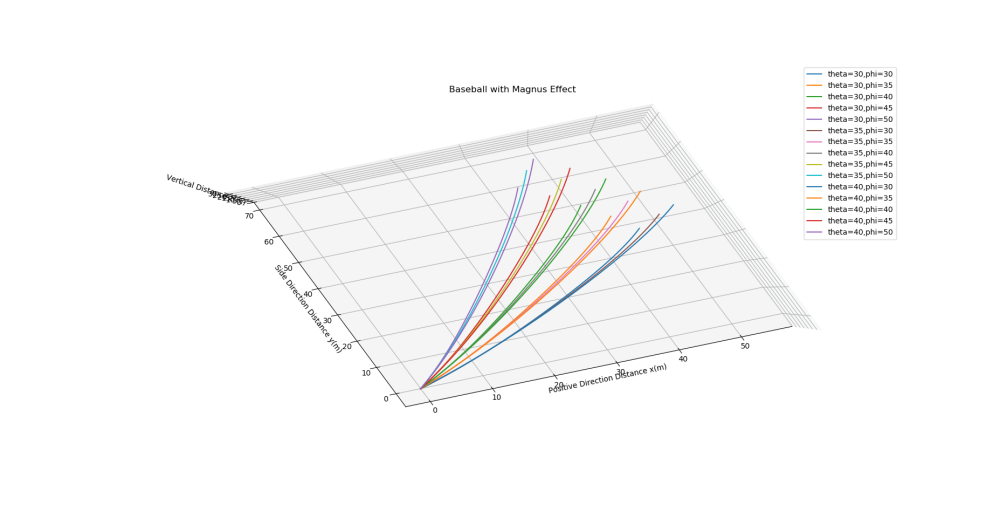
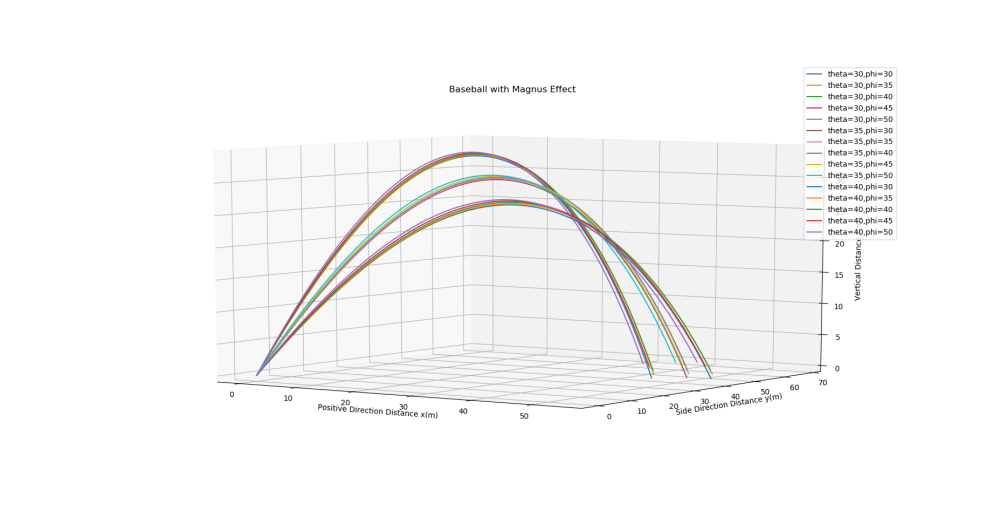
使用Python画考虑Magnus效应的棒球的轨迹
使用Python画考虑Magnus效应的棒球的轨迹
Flappy Baseball with Magnus Effect
Calculate the trajectory of a batted ball hit with side spin. That is, let the rotation axis be vertical, correspending to a ball that is hit so that it "hooks" or "slices."This is commonly encountered in a ball hit near one of the foul lines. Calculate how much a spin angular velocity of 2000 rpm would cause a line drive to curve. Is this consistent with your experiences? If not,calculate what angular velocity would be required.
用到的递归函数
考虑空气阻力和Magnus效应:
$$\frac{dx}{dt} = v_x$$
$$\frac{dv_x}{dt} = -\frac{B_2}{m} v v_x$$
$$\frac{dy}{dt} = v_y$$
$$\frac{dv_y}{dt} = -\frac{S_0}{m} \omega v_x$$
$$\frac{dz}{dt} = v_z$$
$$\frac{dv_z}{dt} = -g$$
参考上周的代码想用3D作图扫一个出来的,但是尝试了一下函数定义的时候好像有点问题,改成print数组都print不出来,也没有报错,可能是步长的问题,我再改改看看问题在哪儿吧……
import matplotlib as mpl
from mpl_toolkits.mplot3d import Axes3D
import numpy as np
import matplotlib.pyplot as plt
定义函数与常数
def Baseball(v, omega, theta, phi):
    v_x = v*np.sin(theta * np.pi/180)*np.cos(phi * np.pi/180);
    v_y = v*np.sin(theta * np.pi/180)*np.sin(phi * np.pi/180);
    v_z = v*np.cos(theta * np.pi/180);
    x = 0.0;                                    #initial position
    y = 0.0;                                    #initial position
    z = 0.0;                                    #initial position
    t = 0.0;                                    #set initial time
    g = 9.8;                                    #set gravity acceleration
    dt = 0.01;                                  #set time steps
    m = 149
    a = 4.1 * 0.0001                            #a stands for S0/m
    delta = 5
    v_d = 35
    b = 0.0039 + (0.0058 / (1 + (np.exp((v - v_d)/delta)))) #b stands for B2/m

    distance=[[] for i in range(4)];             #create a sequence to store x,y,z,t
    distance[0].append(x);
    distance[1].append(y);
    distance[2].append(z);

    while z >= 0:
        a_x = -b * v * v_x;
        a_y = -a * omega * v_x;
        a_z = -g;
        v_x = v_x + a_x * dt;               #Euler's solution in x
        v_y = v_y + a_y * dt;               #Euler's solution in y
        v_z = v_z + a_z * dt;               #Euler's solution in z
        x = x + v_x * dt;                   #Position in x as function of speed
        y = y + v_y * dt;                   #Position in y as function of speed
        z = z + v_z * dt;                   #Position in z as function of speed
        t = t + dt;                         #time steps
        v = np.sqrt(v_x * v_x + v_y * v_y + v_z * v_z);    #total speed
        distance[0].append(x);
        distance[1].append(y);
        distance[2].append(z);
    distance[3].append(t);
    return distance
赋给初值
#set function parameter
velocity = 30.0;                     #set initial speed
angular_v = 2000/60;
画图的部分
#draw the 3D picture

fig = plt.figure()
ax = fig.gca(projection='3d')
for i in range(3):
    angle_theta= i * 5 + 30                 #set a series of theta
    for j in range(5):
        angle_phi = j * 5 + 30          #set a series of phi
        d = Baseball(velocity, angular_v, angle_theta, angle_phi) #1 to select adiabatic approximation
        ax.plot(d[0], d[1], d[2],label='theta='+str(angle_theta)+',phi='+str(angle_phi))
ax.grid(True,color='k')
plt.title('Baseball with Magnus Effect')
ax.set_xlabel('Positive Direction Distance x(m)')
ax.set_ylabel('Side Direction Distance y(m)')
ax.set_zlabel('Vertical Distance z(m)')
ax.legend()

plt.show()
结论与图像
我发现这个3D图还是可以拖拽旋转的……蛮好玩的
原图戳这里
源代码戳这里


